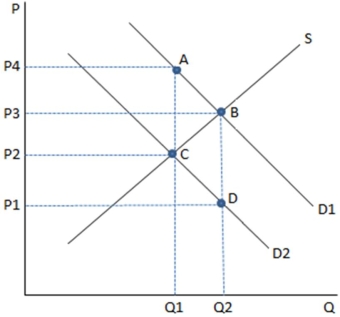
 This graph depicts a tax being imposed,causing demand to shift from D1 to D2.According to the graph shown,the tax caused:
A) an increase in consumption from Q1 to Q2.
B) a decrease in consumption from Q2 to Q1.
C) a decrease in the price consumers pay from P3 to P1.
D) a decrease in the price the suppliers receive from P3 to P1.
Correct Answer:
Verified
Q4: When a tax is present in a
Q7: Which of the following is not an
Q8: An example of a tax-funded program primarily
Q9: Q10: An example of a tax specifically designed Q12: An example of a tax-funded program intended Q13: When a tax alters consumers' incentives,it is: Q14: Concepts useful in evaluating the costs and![]()
A)
Unlock this Answer For Free Now!
View this answer and more for free by performing one of the following actions

Scan the QR code to install the App and get 2 free unlocks

Unlock quizzes for free by uploading documents