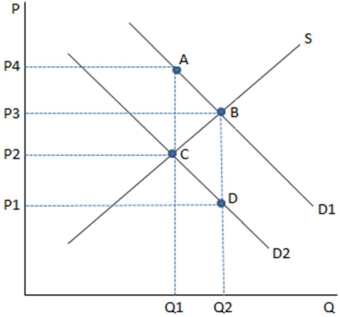
 This graph depicts a tax being imposed,causing demand to shift from D1 to D2.According to the graph shown,the tax caused:
A) positive government revenue and decreased consumption.
B) zero government revenue and decreased consumption.
C) a transfer of revenue to surplus and increased consumption.
D) positive government revenue and increased consumption.
Correct Answer:
Verified
Q10: An example of a tax specifically designed
Q11: Q12: An example of a tax-funded program intended Q13: When a tax alters consumers' incentives,it is: Q14: Concepts useful in evaluating the costs and Q16: Taxes change behavior for all of the Q17: One of the primary aims of taxation Q18: An example of a tax specifically designed Q19: Q20: Unlock this Answer For Free Now! View this answer and more for free by performing one of the following actions Scan the QR code to install the App and get 2 free unlocks Unlock quizzes for free by uploading documents![]()
A)![]()
![]()

