Multiple Choice
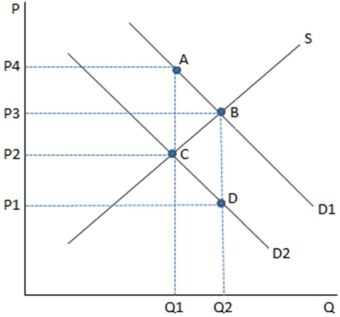 This graph depicts a tax being imposed,causing demand to shift from D1 to D2.The deadweight loss associated with the tax imposed in the graph shown is:
A) equal to area CBD.
B) equal to area ABC.
C) due to the decrease in consumption from Q1 to Q2.
D) equal to area P1DCP2.
Correct Answer:
Verified
Related Questions
Q15: Q16: Taxes change behavior for all of the Q17: One of the primary aims of taxation Q18: An example of a tax specifically designed![]()
Unlock this Answer For Free Now!
View this answer and more for free by performing one of the following actions

Scan the QR code to install the App and get 2 free unlocks

Unlock quizzes for free by uploading documents