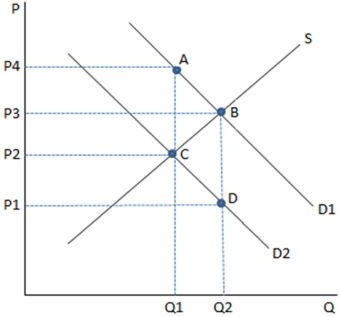
 This graph depicts a tax being imposed,causing demand to shift from D1 to D2.The distance AC in the graph shown represents all of the following except the:
A) amount of the tax.
B) difference between what the consumer pays and what the seller receives.
C) "tax wedge."
D) total tax revenue generated for the government by imposing the tax.
Correct Answer:
Verified
Q14: Concepts useful in evaluating the costs and
Q15: Q16: Taxes change behavior for all of the Q17: One of the primary aims of taxation Q18: An example of a tax specifically designed![]()
Unlock this Answer For Free Now!
View this answer and more for free by performing one of the following actions

Scan the QR code to install the App and get 2 free unlocks

Unlock quizzes for free by uploading documents