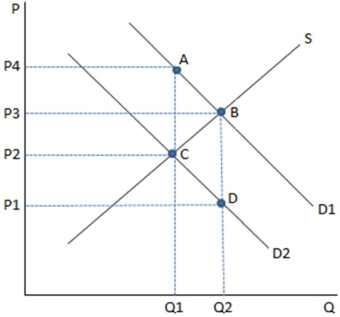
 This graph depicts a tax being imposed,causing demand to shift from D1 to D2.The amount of the tax imposed in the graph shown is equal to:
A) (P1 P3) .
B) (P2 P1) .
C) (P4 P2) .
D) (P4 P3) .
Correct Answer:
Verified
Q1: Many tax-funded programs are intended to:
A) decrease
Q2: The primary intent of the tax on
Q4: In deciding which programs the government should
Q4: When a tax is present in a
Q7: Which of the following is not an
Q8: An example of a tax-funded program primarily
Q9: Q10: An example of a tax specifically designed Q11: One reason governments impose taxes is to: Q11: ![]()
A)raise![]()
Unlock this Answer For Free Now!
View this answer and more for free by performing one of the following actions

Scan the QR code to install the App and get 2 free unlocks

Unlock quizzes for free by uploading documents