This graph demonstrates the domestic demand and supply for a good,as well as a tariff and the world price for that good. 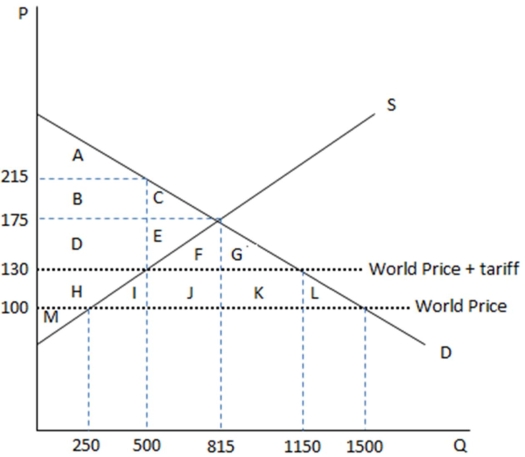 According to the graph shown,if this economy is an autarky,its equilibrium price is:
A) $175 at a quantity of 815.
B) $215 at a quantity of 500.
C) $130 at a quantity of 1150.
D) $130 at a quantity of 500.
Correct Answer:
Verified
Q91: For a single country to influence the
Q92: When a price-taking country joins the global
Q94: A common tool for restricting trade through
Q95: A common tool for restricting trade through
Q95: Actions that reduce trade restrictions and promote
Q97: Laws limiting trade are often referred to
Q97: This graph demonstrates the domestic demand and
Q98: Suppose a country,whose production and consumption of
Q99: Suppose a country,whose production and consumption of
Q101: This graph demonstrates the domestic demand and
Unlock this Answer For Free Now!
View this answer and more for free by performing one of the following actions

Scan the QR code to install the App and get 2 free unlocks

Unlock quizzes for free by uploading documents