This graph demonstrates the domestic demand and supply for a good,as well as a tariff and the world price for that good. 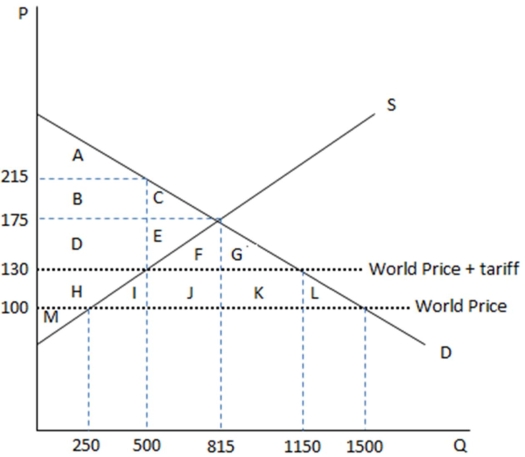 According to the graph shown,the amount of deadweight loss created by the imposition of a tariff is area:
A) IL
B) JK
C) IJKL
D) FGJK
Correct Answer:
Verified
Q95: Actions that reduce trade restrictions and promote
Q96: This graph demonstrates the domestic demand and
Q97: This graph demonstrates the domestic demand and
Q98: Suppose a country,whose production and consumption of
Q99: Suppose a country,whose production and consumption of
Q102: This graph demonstrates the domestic demand and
Q103: This graph demonstrates the domestic demand and
Q104: This graph demonstrates the domestic demand and
Q105: An import quota is:
A) a tax on
Q106: This graph demonstrates the domestic demand and
Unlock this Answer For Free Now!
View this answer and more for free by performing one of the following actions

Scan the QR code to install the App and get 2 free unlocks

Unlock quizzes for free by uploading documents