This graph demonstrates the domestic demand and supply for a good,as well as a tariff and the world price for that good. 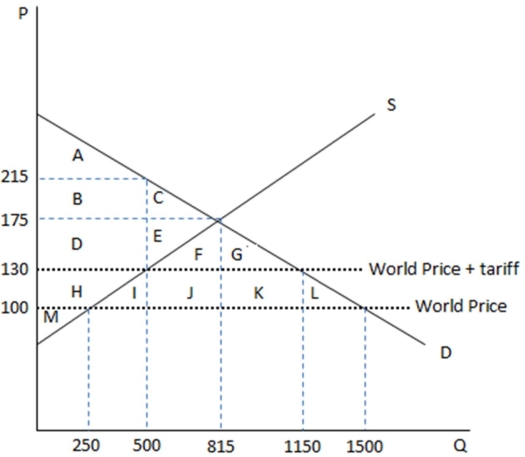 According to the graph shown,the area ABC represents consumer surplus in an economy with:
A) free trade.
B) autarky.
C) a tariff being imposed on trade.
D) None of these is true.
Correct Answer:
Verified
Q103: This graph demonstrates the domestic demand and
Q104: This graph demonstrates the domestic demand and
Q105: An import quota is:
A) a tax on
Q106: This graph demonstrates the domestic demand and
Q107: This graph demonstrates the domestic demand and
Q109: This graph demonstrates the domestic demand and
Q110: This graph demonstrates the domestic demand and
Q111: This graph demonstrates the domestic demand and
Q112: This graph demonstrates the domestic demand and
Q113: This graph demonstrates the domestic demand and
Unlock this Answer For Free Now!
View this answer and more for free by performing one of the following actions

Scan the QR code to install the App and get 2 free unlocks

Unlock quizzes for free by uploading documents