This graph demonstrates the domestic demand and supply for a good,as well as a quota and the world price for that good. 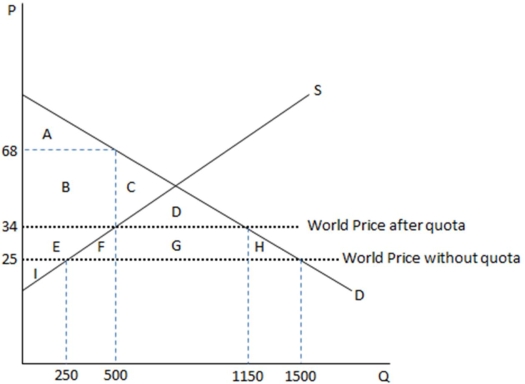 According to the graph shown,the amount bought by domestic consumers when there is open trade for this good is:
A) 1500.
B) 1150
C) 500.
D) 250.
Correct Answer:
Verified
Q104: This graph demonstrates the domestic demand and
Q105: An import quota is:
A) a tax on
Q106: This graph demonstrates the domestic demand and
Q107: This graph demonstrates the domestic demand and
Q108: This graph demonstrates the domestic demand and
Q110: This graph demonstrates the domestic demand and
Q111: This graph demonstrates the domestic demand and
Q112: This graph demonstrates the domestic demand and
Q113: This graph demonstrates the domestic demand and
Q114: This graph demonstrates the domestic demand and
Unlock this Answer For Free Now!
View this answer and more for free by performing one of the following actions

Scan the QR code to install the App and get 2 free unlocks

Unlock quizzes for free by uploading documents