This graph shows the cost and revenue curves faced by a monopoly. 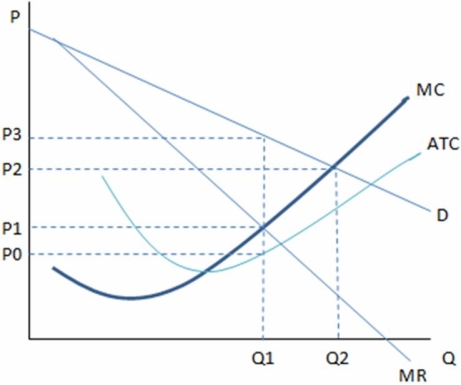 According to the graph shown,the profit being earned by this monopolist is:
A) (P3 P0) ×Q1
B) (P3 P1) × Q1
C) (P1 P0) × Q1
D) (P3 P0) /Q1
Correct Answer:
Verified
Q91: With a monopolist's outcome,producer surplus is:
A) higher
Q92: The presence of a privately-owned monopoly helps:
A)
Q93: The existence of a monopoly:
A) creates market
Q94: This graph shows the cost and revenue
Q95: For markets operating at quantities lower than
Q97: This graph shows the cost and revenue
Q98: The monopolist's outcome happens at a:
A) lower
Q99: This graph shows the cost and revenue
Q100: The existence of a monopoly:
A) creates a
Q101: The government uses the antitrust laws in
Unlock this Answer For Free Now!
View this answer and more for free by performing one of the following actions

Scan the QR code to install the App and get 2 free unlocks

Unlock quizzes for free by uploading documents