This graph shows the cost and revenue curves faced by a monopoly. 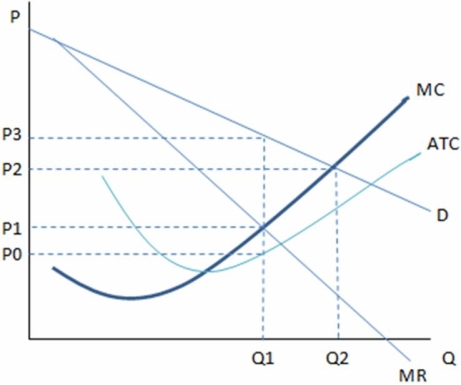 According to the graph shown,if Q2 units are being produced,this monopolist:
A) is not maximizing profits.
B) is producing where marginal costs are less than marginal revenue.
C) is earning negative profits.
D) should increase production.
Correct Answer:
Verified
Q94: This graph shows the cost and revenue
Q95: For markets operating at quantities lower than
Q96: This graph shows the cost and revenue
Q97: This graph shows the cost and revenue
Q98: The monopolist's outcome happens at a:
A) lower
Q100: The existence of a monopoly:
A) creates a
Q101: The government uses the antitrust laws in
Q102: The Sherman Antitrust Act:
A) no longer applies
Q103: Some economists argue the best response to
Q104: This graph shows the cost and revenue
Unlock this Answer For Free Now!
View this answer and more for free by performing one of the following actions

Scan the QR code to install the App and get 2 free unlocks

Unlock quizzes for free by uploading documents