This graph depicts the demand for a normal good. 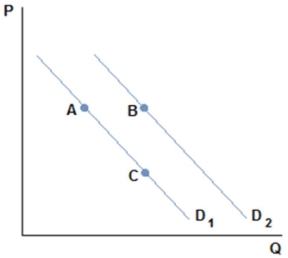 A movement from A to C in the graph shown might be caused by:
A) an increase in price.
B) a decrease in price.
C) an increase in income.
D) a decrease in income.
Correct Answer:
Verified
Q70: This graph depicts the demand for a
Q71: This graph depicts the demand for a
Q72: Roy just got a big promotion at
Q73: What happens to the demand curve when
Q75: There has been a decrease in the
Q76: The city of Burlington is a very
Q77: Darren loves to go to the movies,and
Q78: An increase in the price of ice
Q78: The city of Burlington gets very hot
Q79: Tom was out shopping for a sweater
Unlock this Answer For Free Now!
View this answer and more for free by performing one of the following actions

Scan the QR code to install the App and get 2 free unlocks

Unlock quizzes for free by uploading documents