This graph depicts the demand for a normal good. 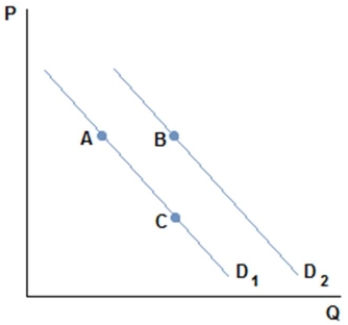 Suppose Johnny was consuming a normal good at point A in the figure shown,but has just received a raise at work.Johnny's demand may:
A) be unaffected.
B) increase to point B.
C) increase to point C.
D) drop to zero.
Correct Answer:
Verified
Q62: Which of the following would not affect
Q65: The price of house paint,a normal good,has
Q66: There has been an increase in the
Q68: This graph depicts the demand for a
Q71: This graph depicts the demand for a
Q72: Roy just got a big promotion at
Q73: What happens to the demand curve when
Q74: This graph depicts the demand for a
Q75: There has been a decrease in the
Q78: An increase in the price of ice
Unlock this Answer For Free Now!
View this answer and more for free by performing one of the following actions

Scan the QR code to install the App and get 2 free unlocks

Unlock quizzes for free by uploading documents