Refer to Figure 7.4.This isoquant exhibits: 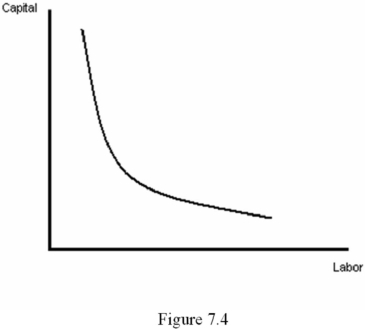
A) increasing MRTSLK as we move to the southeast along the isoquant.
B) declining MRTSLK as we move to the northwest along the isoquant.
C) constant MRTSLK as we move along the isoquant.
D) declining MRTSLK as we move to the southeast along the isoquant.
Correct Answer:
Verified
Q44: Refer to Figure 7.5.Which diagram represents isoquants
Q45: Refer to Figure 7.6.Which graph represents decreasing
Q46: Refer to Figure 7.5.Which diagram represents isoquants
Q47: Returns to scale is a _ concept
Q48: For the Cobb-Douglas production function F(L,K)= ALαKβ,a
Q50: Consider the Cobb-Douglas production function F(L,K)= ALαKβ.Which
Q51: A firm has increasing returns to scale
Q52: Two inputs _ when they must be
Q53: Suppose that the marginal product of a
Q54: Suppose a firm uses 200 units of
Unlock this Answer For Free Now!
View this answer and more for free by performing one of the following actions

Scan the QR code to install the App and get 2 free unlocks

Unlock quizzes for free by uploading documents