Refer to Figure 7.5.Which diagram represents isoquants for inputs that are perfect substitutes? 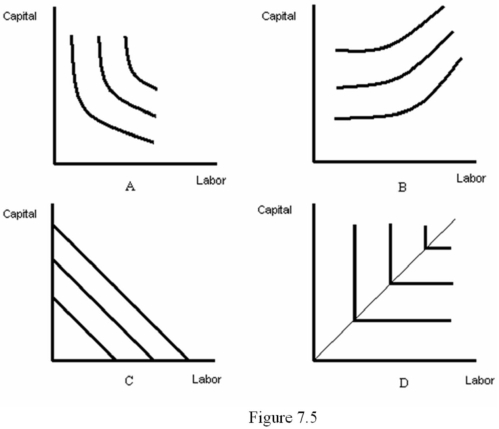
A) A
B) B
C) C
D) D
Correct Answer:
Verified
Q41: One reason that firms will experience decreasing
Q42: With _ returns to scale,production is most
Q43: Suppose a firm uses only capital and
Q44: Refer to Figure 7.5.Which diagram represents isoquants
Q45: Refer to Figure 7.6.Which graph represents decreasing
Q47: Returns to scale is a _ concept
Q48: For the Cobb-Douglas production function F(L,K)= ALαKβ,a
Q49: Refer to Figure 7.4.This isoquant exhibits:
Q50: Consider the Cobb-Douglas production function F(L,K)= ALαKβ.Which
Q51: A firm has increasing returns to scale
Unlock this Answer For Free Now!
View this answer and more for free by performing one of the following actions

Scan the QR code to install the App and get 2 free unlocks

Unlock quizzes for free by uploading documents