Refer to Figure 7.5.Which diagram represents isoquants for a Cobb-Douglas production function? 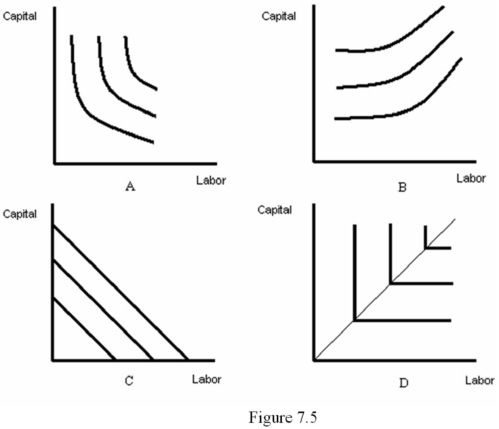
A) A
B) B
C) C
D) D
Correct Answer:
Verified
Q51: A firm has increasing returns to scale
Q52: Two inputs _ when they must be
Q53: Suppose that the marginal product of a
Q54: Suppose a firm uses 200 units of
Q55: Refer to Figure 7.6.Which graph represents constant
Q57: Refer to Figure 7.6.Graph A represents:
Q58: Refer to Figure 7.7.A technological improvement is
Q59: The Cobb-Douglas production function F(L,K)= ALαKβ will
Q60: One reason that firms will experience increasing
Q61: Suppose a firm uses both labor (L)and
Unlock this Answer For Free Now!
View this answer and more for free by performing one of the following actions

Scan the QR code to install the App and get 2 free unlocks

Unlock quizzes for free by uploading documents