Refer to Figure 7.6.Graph A represents: 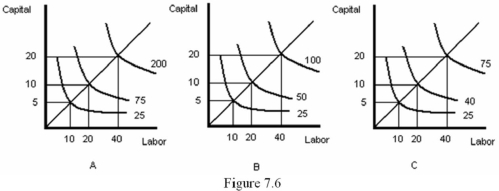
A) increasing returns to scale.
B) decreasing returns to scale.
C) constant returns to scale.
D) diminishing marginal returns.
Correct Answer:
Verified
Q52: Two inputs _ when they must be
Q53: Suppose that the marginal product of a
Q54: Suppose a firm uses 200 units of
Q55: Refer to Figure 7.6.Which graph represents constant
Q56: Refer to Figure 7.5.Which diagram represents isoquants
Q58: Refer to Figure 7.7.A technological improvement is
Q59: The Cobb-Douglas production function F(L,K)= ALαKβ will
Q60: One reason that firms will experience increasing
Q61: Suppose a firm uses both labor (L)and
Q62: For the Cobb-Douglas production function F(L,K)= ALαKβ,a
Unlock this Answer For Free Now!
View this answer and more for free by performing one of the following actions

Scan the QR code to install the App and get 2 free unlocks

Unlock quizzes for free by uploading documents