Refer to Figure 3.1.Which graph best represents the total cost of an activity? 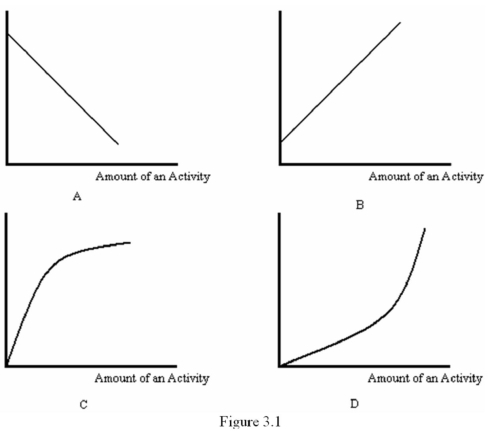
A) A
B) B
C) C
D) D
Correct Answer:
Verified
Q12: "If the cost of college tuition goes
Q13: Refer to Table 3.1.Suppose that you have
Q14: Refer to Table 3.1.Suppose there is a
Q15: An economic explanation as to why individuals
Q16: Refer to Table 3.2,which shows some costs
Q18: Refer to Figure 3.1.Which graph best represents
Q19: Suppose that adding a new disc drive
Q20: Refer to Table 3.2,which shows some costs
Q21: When actions are finely divisible,the marginal benefit
Q22: The marginal units of action choice X:
A)
Unlock this Answer For Free Now!
View this answer and more for free by performing one of the following actions

Scan the QR code to install the App and get 2 free unlocks

Unlock quizzes for free by uploading documents