Refer to Figure 3.1.Which graph best represents the total benefit of an activity? 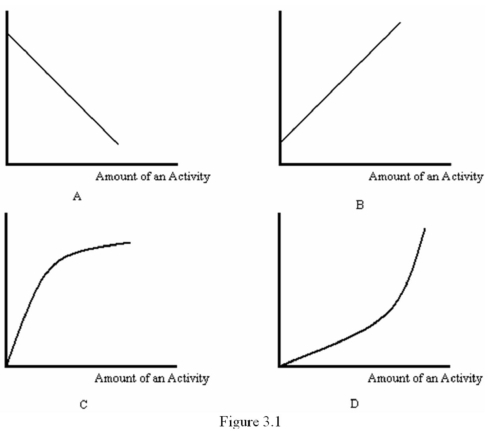
A) A
B) B
C) C
D) D
Correct Answer:
Verified
Q13: Refer to Table 3.1.Suppose that you have
Q14: Refer to Table 3.1.Suppose there is a
Q15: An economic explanation as to why individuals
Q16: Refer to Table 3.2,which shows some costs
Q17: Refer to Figure 3.1.Which graph best represents
Q19: Suppose that adding a new disc drive
Q20: Refer to Table 3.2,which shows some costs
Q21: When actions are finely divisible,the marginal benefit
Q22: The marginal units of action choice X:
A)
Q23: Figure 3.2 shows the total cost and
Unlock this Answer For Free Now!
View this answer and more for free by performing one of the following actions

Scan the QR code to install the App and get 2 free unlocks

Unlock quizzes for free by uploading documents