Refer to Figure 2.2.Which diagram represents the effect of a lower gasoline price on the supply of gasoline? 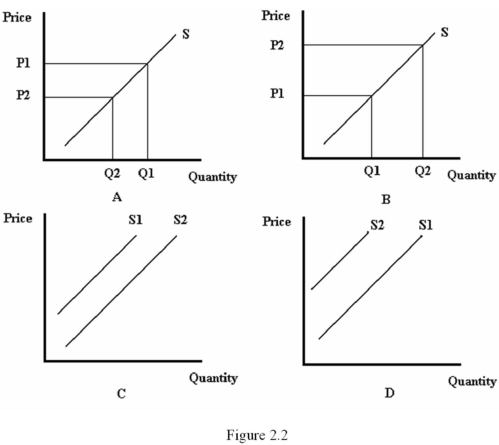
A) A
B) B
C) C
D) D
Correct Answer:
Verified
Q30: A change in the quantity supplied of
Q31: Which of the following is a factor
Q32: Consider the relationship given by QCars =
Q33: Which of the following would result from
Q34: Which of the following best describes the
Q36: A product's _ describes the amount of
Q37: Excess supply is:
A) the result of a
Q38: Suppose that the demand for movies is
Q39: Refer to Figure 2.2.Which diagram best represents
Q40: Refer to Figure 2.3.At a price of
Unlock this Answer For Free Now!
View this answer and more for free by performing one of the following actions

Scan the QR code to install the App and get 2 free unlocks

Unlock quizzes for free by uploading documents