Refer to Figure 2.3.At a price of $10 per CD,there would be: 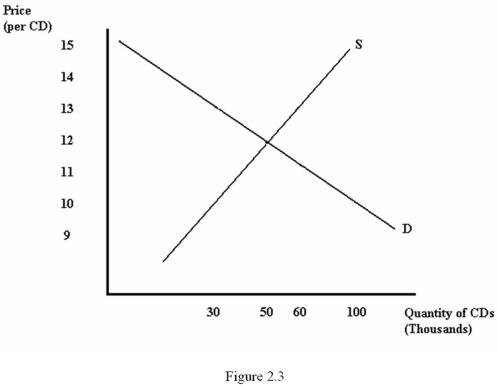
A) excess supply of 70 thousand CDs.
B) excess demand of 50 thousand CDs.
C) excess supply of 50 thousand CDs.
D) excess demand of 70 thousand CDs.
Correct Answer:
Verified
Q35: Refer to Figure 2.2.Which diagram represents the
Q36: A product's _ describes the amount of
Q37: Excess supply is:
A) the result of a
Q38: Suppose that the demand for movies is
Q39: Refer to Figure 2.2.Which diagram best represents
Q41: Refer to Figure 2.4.The elasticity of demand
Q42: The _ the demand curve,the _ responsive
Q43: Suppose a good has a demand curve
Q44: Demand is said to be elastic when:
A)
Q45: Supply curves tend to be _ in
Unlock this Answer For Free Now!
View this answer and more for free by performing one of the following actions

Scan the QR code to install the App and get 2 free unlocks

Unlock quizzes for free by uploading documents