Consider the following diagram: 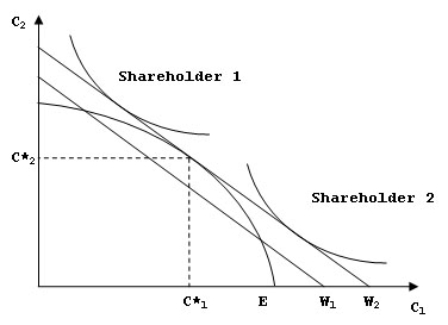
In this diagram,if the optimal policy is chosen,the company invests the amount:
A) W1-E
B) W1-C*1
C) E-C*1
D) W2-E
Correct Answer:
Verified
Q39: Consider the following investment/dividend opportunities facing a
Q40: Consider the following set of indifference curves:
Q41: A company can make optimal decisions to
Q42: An indifference curve represents a set of
Q43: In practice,managers are unable to predict with
Q45: B1 and B2 are equal shareholders in
Q46: The shape of the production possibilities curve
Q47: Consider the following diagram: Q48: In the absence of _ companies are Q49: Fisher's separation theorem has no implications for![]()
Unlock this Answer For Free Now!
View this answer and more for free by performing one of the following actions

Scan the QR code to install the App and get 2 free unlocks

Unlock quizzes for free by uploading documents