B1 and B2 are equal shareholders in the company Banana Inc.They have each invested $200 in the company.The following graph shows on a per shareholder basis the production possibilities curve,B1 and B2's indifference curves and the market opportunity line.
(a)What is the interest rate?
(b)How much is invested by the company at the optimal point?
(c)Assuming that the company invests at the optimal point,complete the following table (where applicable)for shareholder B1. 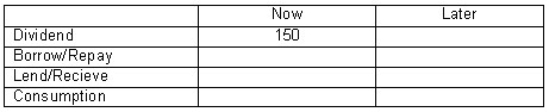 (d)Assuming that the company invests at the optimal point,complete the following table (where applicable)for B2.
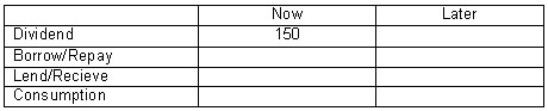
Correct Answer:
Verified
Q40: Consider the following set of indifference curves:
Q41: A company can make optimal decisions to
Q42: An indifference curve represents a set of
Q43: In practice,managers are unable to predict with
Q44: Consider the following diagram: Q46: The shape of the production possibilities curve![]()
Unlock this Answer For Free Now!
View this answer and more for free by performing one of the following actions

Scan the QR code to install the App and get 2 free unlocks

Unlock quizzes for free by uploading documents