Figure 2.2 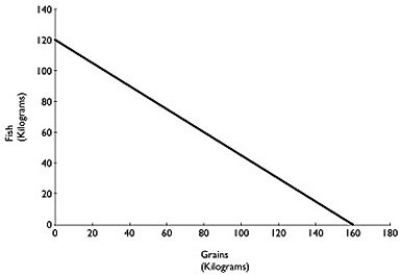 Figure 2.2 above shows the production possibilities frontier for Atikamekw Cree (ca.1600) with a historical tradition of fishing and farming.Assume they produce two goods: fish and grains.
Alt text for Figure 2.2: In figure 2.2,a graph compares production of grains and fish.
Long description for Figure 2.2: The x-axis is labelled,grains in kilograms,and the y-axis is labelled,fish in kilograms.The x-axis is marked from 0 to 180,in increments of 20.The y-axis is marked from 0 to 140,in increments of 20.A line slopes down from the point 0,120 to the point 160,0.
-Refer to Figure 2.2.What is the opportunity cost of one kilogram of Fish?
A)  kilogram of grain
B)  kilograms of grain
C) 1.6 kilograms of grain
D) 16 kilograms of grain
Correct Answer:
Verified
Q1: The production possibilities frontier model assumes which
Q4: If the production possibilities frontier is _,
Q5: Figure 2-1 Q6: The points outside the production possibilities frontier Q9: The production possibilities frontier model shows that Q11: Figure 2.2 Q19: Bella can produce either a combination of Q20: In a production possibilities frontier model, a Q20: Figure 2-1 Q36: A production possibilities frontier with a bowed-outward Unlock this Answer For Free Now! View this answer and more for free by performing one of the following actions Scan the QR code to install the App and get 2 free unlocks Unlock quizzes for free by uploading documents
![]()
A)if![]()
![]()

