Figure 6.6 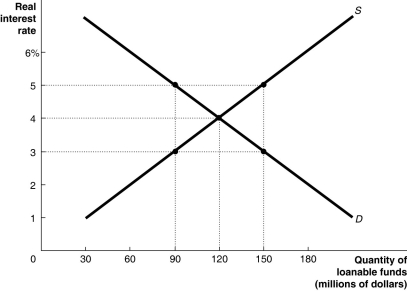 Alt text for Figure 6.6: In figure 6.6, a graph shows loanable funds market in equilibrium.
Long description for Figure 6.6: The x-axis is labelled, quantity of loanable funds (millions of dollars) , ranging from 0 to 180 in increments of 30.The y-axis is labelled real interest rate, ranging from 0 to 6% in increments of 1.2 intersecting lines are shown.A line labelled D begins at the top left corner and slopes down toward the end of the x-axis.Another line labelled S begins near the origin and slopes upward to the top right corner.5 points are plotted on these two lines as (90, 5) , (90, 3) , (120, 4) , (150, 5) , (150, 3) .These points are connected to their respective coordinates on the x-axis and y-axis using dotted lines.
-Refer to Figure 6.6.The loanable funds market is given in the figure above.If the current real interest rate is 5 percent, which of the following is true?
A) The loanable funds market is in equilibrium.
B) There is a surplus of loanable funds in the market.
C) There is a shortage of loanable funds in the market.
D) The quantity of loanable funds being demanded in the market is less than $90 million.
E) The quantity of loanable funds is undetermined.
Correct Answer:
Verified
Q161: Retained earnings are sufficient to finance a
Q164: Empirical evidence shows that the impact of
Q168: Carefully define the two categories of saving
Q192: Which of the following would occur if
Q193: Which of the following will increase the
Unlock this Answer For Free Now!
View this answer and more for free by performing one of the following actions

Scan the QR code to install the App and get 2 free unlocks

Unlock quizzes for free by uploading documents