Multiple Choice
Figure 12-9
The figure below depicts average total cost functions for a firm that produces automobiles. 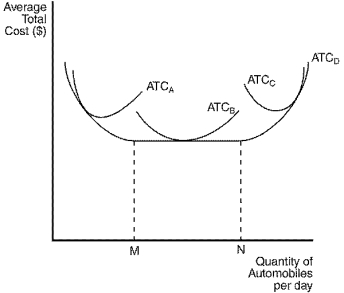
-Refer to Figure 12-9.Which curve represents the long-run average total cost?
A) ATCA
B) ATCB
C) ATCC
D) ATCD
Correct Answer:
Verified
Related Questions
Q138: Diseconomies of scale occur when a firm's
A)marginal
Q259: Firms may experience diseconomies of scale when
A)they
Q422: Figure 12-10 Q423: Figure 12-10 Q425: Figure 12-9 Q426: Figure 12-9 Unlock this Answer For Free Now! View this answer and more for free by performing one of the following actions Scan the QR code to install the App and get 2 free unlocks Unlock quizzes for free by uploading documents![]()
![]()
The figure below depicts average total
The figure below depicts average total

