Figure 12-10 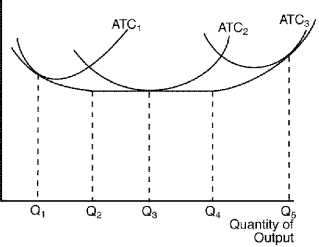
-Refer to Figure 12-10.The three average total cost curves on the diagram labeled ATC1,ATC2,and ATC3 most likely correspond to three different
A) time horizons.
B) products.
C) firms.
D) factory sizes.
Correct Answer:
Verified
Q119: Constant returns to scale occur when a
Q135: When a firm experiences diseconomies of scale,
A)short-run
Q244: Economies of scale occur when
A)long-run average total
Q254: A firm that wants to achieve economies
Q259: Firms may experience diseconomies of scale when
A)they
Q417: In the long run Firm A incurs
Unlock this Answer For Free Now!
View this answer and more for free by performing one of the following actions

Scan the QR code to install the App and get 2 free unlocks

Unlock quizzes for free by uploading documents