Multiple Choice
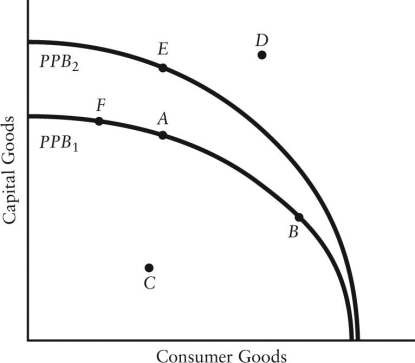
The diagram below shows two production possibilities boundaries for Country X.  FIGURE 1-4
-Refer to Figure 1-4.Growth in the country's productive capacity is illustrated by
A) a point like D outside the boundary.
B) a movement from a point inside the boundary such as C to the boundary.
C) the movement between points on a given boundary.
D) a single point such as A on the boundary.
E) an outward shift of the boundary,for example from PPB1 to PPB2.
Correct Answer:
Verified
Related Questions
Q62: On a diagram of a production possibilities
Q70: The downward-sloping line in the diagram below
Q70: A straight-line production possibilities boundary differs from

