Multiple Choice
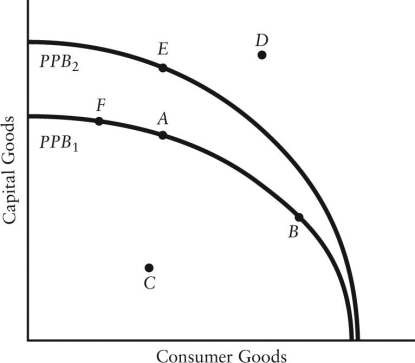
The diagram below shows two production possibilities boundaries for Country X.  FIGURE 1-4
-Refer to Figure 1-4.An outward shift of the production possibilities boundary from  to
to  indicates which of the following?
A) an increase in the price of raw materials for consumer goods
B) growth in the country's productive capacity
C) an increase in the price of raw material for capital goods
D) more of the country's resources are being used
E) the country's resources are being used less efficiently
Correct Answer:
Verified
Related Questions
Q70: The downward-sloping line in the diagram below
Q70: A straight-line production possibilities boundary differs from

