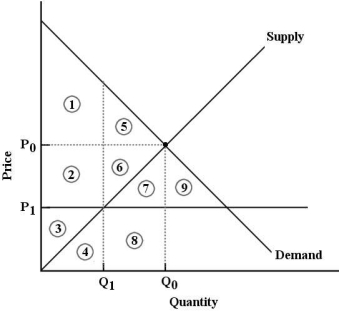
 FIGURE 5-6
-Refer to Figure 5-6.The market for good X is in equilibrium at P0 and Q0.Economic surplus is represented by
A) areas 1 and 5.
B) areas 2,3,4,6,7,8.
C) areas 1,2,3,5,6.
D) areas 1,2,3,4,5,6,7,8.
E) areas 2,3,4,6,7,8,9.
Correct Answer:
Verified
Q101: The diagram below shows the market for
Q102: Suppose a binding output quota is imposed
Q103: Consider the following demand and supply schedules
Q104: In competitive markets,binding price floors and binding
Q105: Consider the following demand and supply schedules
Q107: The diagram below shows the market for
Q108: Output quotas are commonly used in markets
Unlock this Answer For Free Now!
View this answer and more for free by performing one of the following actions

Scan the QR code to install the App and get 2 free unlocks

Unlock quizzes for free by uploading documents