Multiple Choice
The diagram below shows the market for litres of milk. 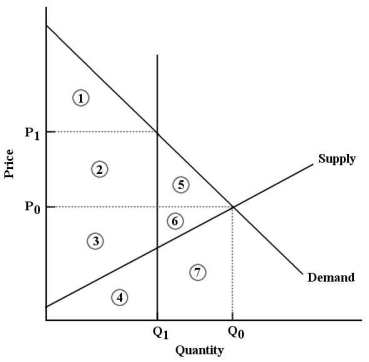 FIGURE 5-8
-Refer to Figure 5-8.After the imposition of a milk quota at quantity  ,the deadweight loss in this market is represented by
A) area 1.
B) areas 1 and 4.
C) areas 1,2,and 5.
D) areas 5 and 6.
E) areas 5,6,and 7.
Correct Answer:
Verified
Related Questions
Q102: Suppose a binding output quota is imposed
Q103: Consider the following demand and supply schedules
Q104: In competitive markets,binding price floors and binding
Q105: Consider the following demand and supply schedules

