Diagrams A,B,and C show 3 individual consumers' demand curves for cement.Consumers A,B,and C constitute the entire monthly cement market in this region. 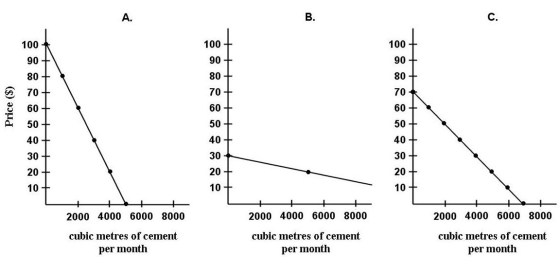 FIGURE 6-3
-Refer to Figure 6-3.What is the market demand (in cubic metres per month) for cement at a price of $60 per cubic metre?
A) 0
B) 1000
C) 2000
D) 3000
E) 4000
Correct Answer:
Verified
Q55: Bjorn is a student with a monthly
Q56: Suppose a consumer can purchase only two
Q57: Laurie spends all of her money buying
Q58: Diagrams A,B,and C show 3 individual consumers'
Q59: If the income effect of a price
Q61: Consider the pizza market,with a downward-sloping demand
Q62: Consider the substitution and income effects of
Q63: Given a typical downward-sloping demand curve in
Q64: In which of the following situations will
Q65: ![]()
Unlock this Answer For Free Now!
View this answer and more for free by performing one of the following actions

Scan the QR code to install the App and get 2 free unlocks

Unlock quizzes for free by uploading documents