 FIGURE 6-5
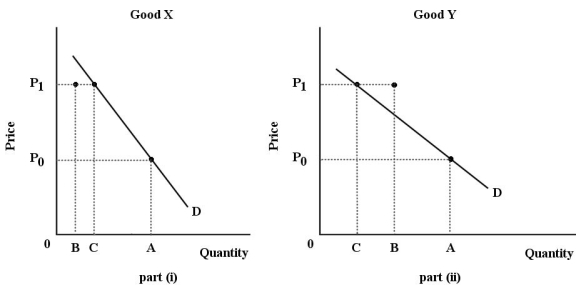
-Refer to Figure 6-5.For both goods,the price increases from P0 to P1.The substitution effect is illustrated by the change in quantity demanded from A to B; the income effect is illustrated by the change in quantity demanded from B to C.Good Y is certainly a(n) ________ good.
A) inferior
B) normal
C) luxury
D) necessity
E) Giffen
Correct Answer:
Verified
Q60: Diagrams A,B,and C show 3 individual consumers'
Q61: Consider the pizza market,with a downward-sloping demand
Q62: Consider the substitution and income effects of
Q63: Given a typical downward-sloping demand curve in
Q64: In which of the following situations will
Q66: Consider the substitution and income effects of
Unlock this Answer For Free Now!
View this answer and more for free by performing one of the following actions

Scan the QR code to install the App and get 2 free unlocks

Unlock quizzes for free by uploading documents