 FIGURE 6-5
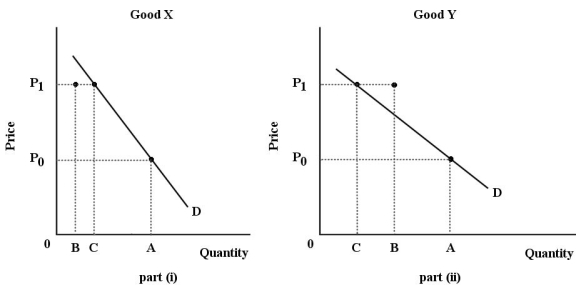
-Refer to Figure 6-5.For both goods,the price increases from P0 to P1.The substitution effect is illustrated by the change in quantity demanded from A to B; the income effect is illustrated by the change in quantity demanded from B to C.Good X is certainly a(n) ________ good.
A) normal
B) inferior
C) luxury
D) necessity
E) Giffen
Correct Answer:
Verified
Q62: Consider the substitution and income effects of
Q63: Given a typical downward-sloping demand curve in
Q64: In which of the following situations will
Q65: Q66: Consider the substitution and income effects of Q68: Suppose a consumer can purchase only two Q69: The substitution effect is Q70: In which of the following situations will Q71: The demand curve for a good with Q72: ![]()
A)the change in quantity![]()
Unlock this Answer For Free Now!
View this answer and more for free by performing one of the following actions

Scan the QR code to install the App and get 2 free unlocks

Unlock quizzes for free by uploading documents