The figure below shows the demand schedule and demand curve for a product produced by a single-price monopolist. 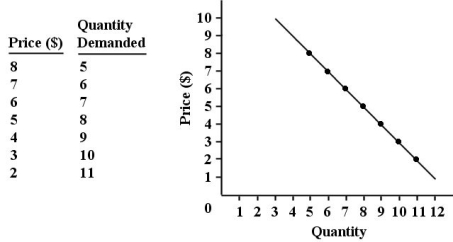 FIGURE 10-1
-Refer to Figure 10-1.Suppose this single-price monopolist is initially selling 5 units at $8 each and then reduces the price of the product to $6.By making this change,the firm is giving up revenue of ________ on the original number of units sold and gaining revenue of ________ on the additional units sold.Its marginal revenue is therefore ________.(All figures are dollars.)
A) 38; 40; 2
B) 8; 6; 2
C) 10; 12; 2
D) 14; 14; 0
E) 5; 7; -2
Correct Answer:
Verified
Q7: The demand curve facing a single-price monopolist
Q8: Marginal revenue is less than price for
Q9: Q10: One similarity between a monopolist and a Q11: The figure below shows the demand schedule Q13: Q14: Q15: Consider a profit-maximizing single-price monopolist that faces Q16: The average revenue curve for a single-price Q17: Unlock this Answer For Free Now! View this answer and more for free by performing one of the following actions Scan the QR code to install the App and get 2 free unlocks Unlock quizzes for free by uploading documents![]()
![]()
![]()
![]()

