The figure below shows the demand schedule and demand curve for a product produced by a single-price monopolist. 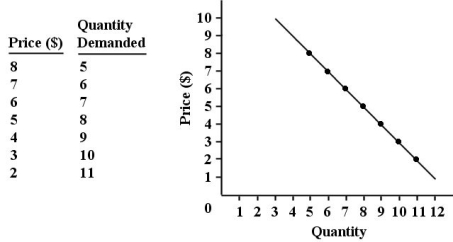 FIGURE 10-1
-Refer to Figure 10-1.Suppose this single-price monopolist is initially selling 9 units at $4 each and then reduces the price of the product to $3.By making this change,the firm is giving up revenue of ________ on the original number of units sold and gaining revenue of ________ on the additional units sold.Its marginal revenue is therefore ________.(All figures are dollars)
A) 40; 27; -13
B) 30; 36; 6
C) 34; 28; -6
D) 9; 3; -6
E) 3; 9; 6
Correct Answer:
Verified
Q6: Q7: The demand curve facing a single-price monopolist Q8: Marginal revenue is less than price for Q9: Q10: One similarity between a monopolist and a Q12: The figure below shows the demand schedule Unlock this Answer For Free Now! View this answer and more for free by performing one of the following actions Scan the QR code to install the App and get 2 free unlocks Unlock quizzes for free by uploading documents![]()
![]()

