The diagram below shows demand and cost curves for a monopolistically competitive firm. 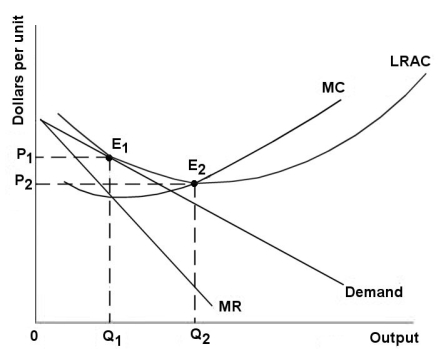 FIGURE 11-3
-Refer to Figure 11-3.If an increase in industry demand led to an outward shift in each firm's demand curve,and no change to the firm's costs,the typical firm would
A) be making profits and new firms would enter the industry in the long run.
B) be making losses and some firms would exit the industry in the long run.
C) would expand its output in the long run.
D) increase costs in order to break even at P1 and Q1 in the long run.
E) decrease costs in order to break even at P1 and Q1 in the long run.
Correct Answer:
Verified
Q59: Q60: Q61: The excess-capacity theorem predicts that Q62: The diagram below shows selected cost and Q63: One characteristic of oligopolistic markets is Q65: Consider the following statement: "A monopolistically competitive Q66: The diagram below shows demand and cost Q67: The diagram below shows demand and cost Q68: The diagram below shows demand and cost Q69: If firms are able to freely enter![]()
![]()
A)when price-taking firms
A)ease of
Unlock this Answer For Free Now!
View this answer and more for free by performing one of the following actions

Scan the QR code to install the App and get 2 free unlocks

Unlock quizzes for free by uploading documents