The diagram below shows selected cost and revenue curves for a firm in a monopolistically competitive industry. 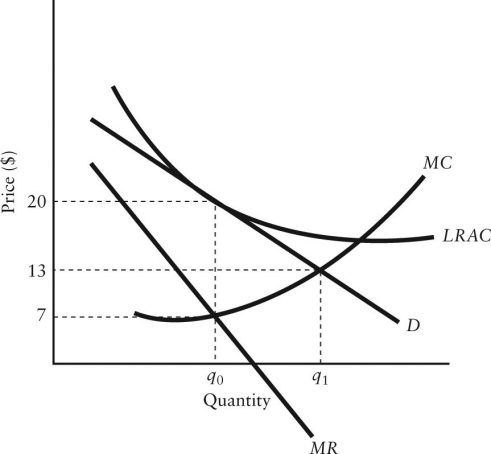 FIGURE 11-4
-Refer to Figure 11-4.Which of the following best describes this industry if all firms have the same cost and revenue curves and are producing output of  ?
?
A) firms are earning positive profits and new firms will enter the industry until all firms are operating at their minimum LRAC
B) all firms are earning positive profits and there is no incentive for firms to enter or exit the industry
C) firms are earning zero profits and there is no incentive for firms to enter or leave the industry
D) all firms will try to minimize costs and move toward minimum LRAC
E) firms are incurring losses and firms will exit this industry
Correct Answer:
Verified
Q57: Q58: A good example of a monopolistically competitive Q59: Q60: Q61: The excess-capacity theorem predicts that Q63: One characteristic of oligopolistic markets is Q64: The diagram below shows demand and cost Q65: Consider the following statement: "A monopolistically competitive Q66: The diagram below shows demand and cost Q67: The diagram below shows demand and cost Unlock this Answer For Free Now! View this answer and more for free by performing one of the following actions Scan the QR code to install the App and get 2 free unlocks Unlock quizzes for free by uploading documents![]()
![]()
![]()
A)when price-taking firms
A)ease of

