The diagram below shows demand and supply curves for some perfectly competitive market. 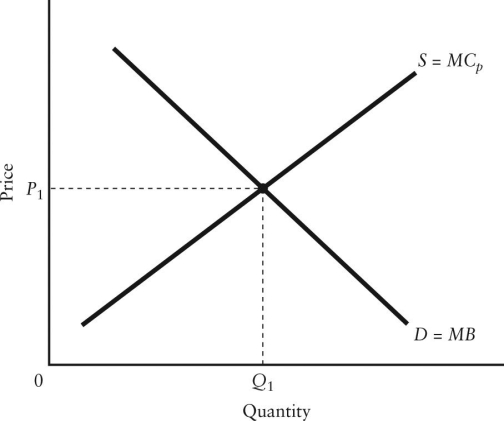 FIGURE 16-2
-Refer to Figure 16-2.Suppose that the marginal benefit curve (MB) includes all social benefits and that there are no externalities in production.In this case,________ for allocative efficiency.
A) P1 and Q1 are appropriate
B) the price P1 is appropriate but the quantity Q1 is too low
C) the price P1 is appropriate but the quantity Q1 is too high
D) the price P1 is too low but the quantity Q1 is appropriate
E) the price P1 is too high but the quantity Q1 is appropriate
Correct Answer:
Verified
Q38: Q39: Which of the following phenomena is NOT Q40: Q41: Why might it be economically efficient to Q42: The diagram below shows demand and supply Q44: The diagram below shows the supply and Q45: The diagram below shows the supply and Q46: The diagram below shows the supply and Q47: An example of a rivalrous good is Q48: Economists consider a product such as a![]()
![]()
A)toxic
Unlock this Answer For Free Now!
View this answer and more for free by performing one of the following actions

Scan the QR code to install the App and get 2 free unlocks

Unlock quizzes for free by uploading documents