Multiple Choice
The diagram below shows demand and supply curves for some perfectly competitive market. 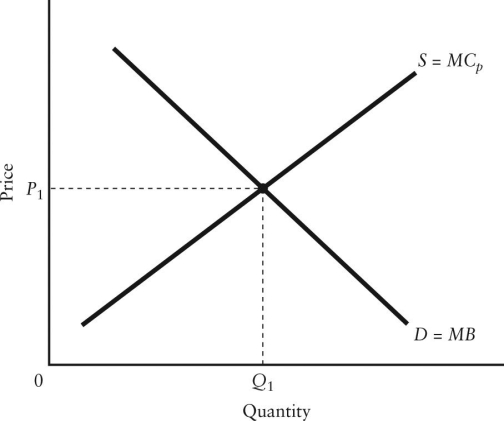 FIGURE 16-2
-Refer to Figure 16-2.Suppose that the marginal benefit curve (MB) includes all social benefits and that there is a negative externality in production.In this case,________ for allocative efficiency.
A) P1 and Q1 are appropriate
B) the price P1 is appropriate but the quantity Q1 is too low
C) the price P1 is appropriate but the quantity Q1 is too high
D) the price P1 is too low and the quantity Q1 is too high
E) the price P1 is too high and the quantity Q1 is too low
Correct Answer:
Verified
Related Questions

