The demand curve shown below has four points depicting possible total market oligopoly outcomes of quantity and price. For the given demand and price coordinates labeled A-D, pick the matching oligopoly models that lead to these comparative outcomes. 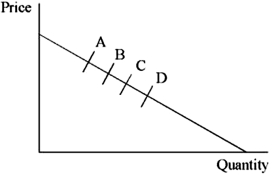
A) A = Bertrand: B = Cournot: C = Stackelberg: D = Shared Monopoly
B) A = Cournot: B = Bertrand: C = Stackelberg: D = Shared Monopoly
C) A = Shared Monopoly: B = Cournot: C = Bertrand: D = Stackelberg
D) A = Shared Monopoly: B = Cournot: C = Stackelberg: D = Bertrand
Correct Answer:
Verified
Q20: In the Stackelberg model,
A)each firm takes the
Q21: Suppose that firms are located in a
Q22: The graph below shows the Chamberlin model.
Q23: Suppose that firms are located in a
Q24: Suppose that firms are located in
Q26: Which of the following is an application
Q27: The graph below shows the Chamberlin model.
Q28: Suppose that firms are located in a
Q29: The graph below shows the Chamberlin model.
Q30: If a monopolistically competitive firm is making
Unlock this Answer For Free Now!
View this answer and more for free by performing one of the following actions

Scan the QR code to install the App and get 2 free unlocks

Unlock quizzes for free by uploading documents