The graph below shows the Chamberlin model. If additional firms enter the market we would expect 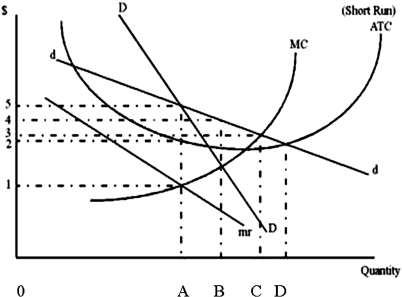
A) the DD curve to shift right.
B) each individual firm to be worse off.
C) the dd curve to become steeper.
D) the MC and ATC curves to shift downward.
Correct Answer:
Verified
Q24: Suppose that firms are located in
Q25: The demand curve shown below has four
Q26: Which of the following is an application
Q27: The graph below shows the Chamberlin model.
Q28: Suppose that firms are located in a
Q30: If a monopolistically competitive firm is making
Q31: Suppose there are two firms in a
Q32: The graph below shows the Chamberlin model.
Q33: The graph below shows the Chamberlin model.
Q34: In the long run, a monopolistically competitive
Unlock this Answer For Free Now!
View this answer and more for free by performing one of the following actions

Scan the QR code to install the App and get 2 free unlocks

Unlock quizzes for free by uploading documents