The graph below shows the Chamberlin model. One would expect the demand curve facing a monopolistically competitive firm to be 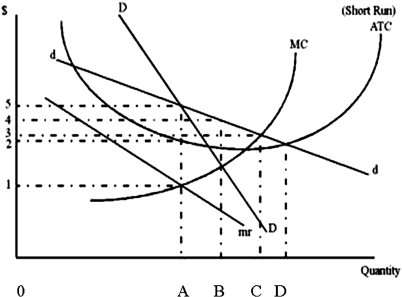
A) more elastic than a monopoly in the same industry.
B) less elastic than a monopoly in the same industry.
C) more elastic than a perfectly competitive firm in the same industry.
D) as elastic as a monopoly in the same industry.
Correct Answer:
Verified
Q27: The graph below shows the Chamberlin model.
Q28: Suppose that firms are located in a
Q29: The graph below shows the Chamberlin model.
Q30: If a monopolistically competitive firm is making
Q31: Suppose there are two firms in a
Q33: The graph below shows the Chamberlin model.
Q34: In the long run, a monopolistically competitive
Q35: The graph below shows the Chamberlin model.
Q36: Suppose that two firms are producers of
Q37: The variety that monopolistic competition provides is
Unlock this Answer For Free Now!
View this answer and more for free by performing one of the following actions

Scan the QR code to install the App and get 2 free unlocks

Unlock quizzes for free by uploading documents