The graph below shows the Chamberlin model. The profit maximization level of output for a monopolistically competitive firm is 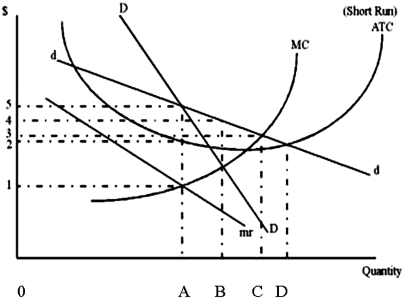
A) 0A.
B) 0B.
C) 0C.
D) 0D.
Correct Answer:
Verified
Q28: Suppose that firms are located in a
Q29: The graph below shows the Chamberlin model.
Q30: If a monopolistically competitive firm is making
Q31: Suppose there are two firms in a
Q32: The graph below shows the Chamberlin model.
Q34: In the long run, a monopolistically competitive
Q35: The graph below shows the Chamberlin model.
Q36: Suppose that two firms are producers of
Q37: The variety that monopolistic competition provides is
Q38: Suppose that firms are located in a
Unlock this Answer For Free Now!
View this answer and more for free by performing one of the following actions

Scan the QR code to install the App and get 2 free unlocks

Unlock quizzes for free by uploading documents