Multiple Choice
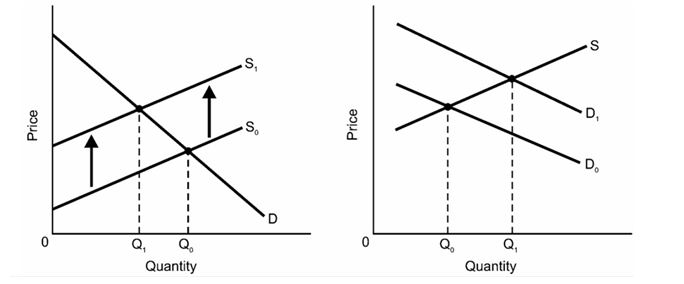
-In the first diagram,if the distance between S0 and S1 represents all spillover effects in this market,excess benefit when output is at Q0 equals the area:
A) under the entire demand curve D
B) separating the lines S1 and D between Q1 and Q0
C) separating the lines D and S1 between the vertical axis and Q1
D) separating the lines D and S0 between the vertical axis and Q0
E) separating the lines D and S1 between the vertical axis and Q1, minus the area separating the lines S1 and D between Q1 and Q0
Correct Answer:
Verified
Related Questions

