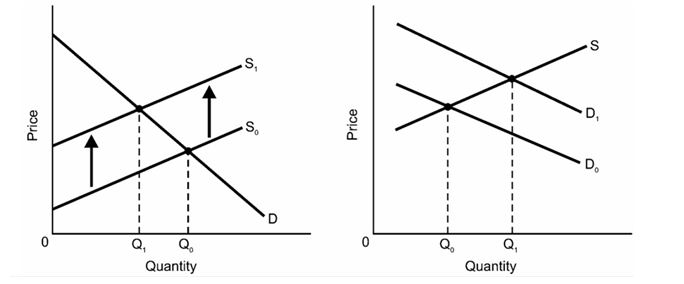
-In the second diagram,if the distance between D0 and D1 represents all spillover effects in this market,excess benefit when output level is at Q1 equals the area:
A) under the entire demand curve D0
B) under the entire demand curve D1
C) above S and below D1 between the vertical axis and Q1
D) above S and below D0 between the vertical axis and Q0
E) above S and below D0 between the vertical axis and Q1
Correct Answer:
Verified
Q29: Q30: An example of a public good is: Q31: A subsidy: Q32: Q33: Q35: Which of the following statements is correct? Q36: The existence of spillover effects weakens the Q37: Which of the following is a public Q38: Q39: Unlock this Answer For Free Now! View this answer and more for free by performing one of the following actions Scan the QR code to install the App and get 2 free unlocks Unlock quizzes for free by uploading documents![]()
A)a
A)should be provided when there are![]()
![]()
A)Private![]()
![]()

