The following graph illustrates a low wage labor market. 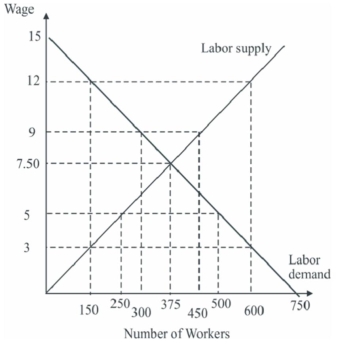
Suppose a minimum wage of $12 is imposed in this labor market to improve the wages of low wage workers.This results in
A) 225 workers losing their jobs.
B) 375 workers receiving $12 an hour.
C) an improvement in the economic status of the original 375 workers.
D) a new equilibrium at $12 and 150 workers.
Correct Answer:
Verified
Q97: The degree of income inequality produced by
Q117: Matt is offered a job driving the
Q119: Jen is offered a job answering the
Q120: Means-tested welfare benefits provide an incentive to
A)leave
Q121: If the elasticity of demand for labor
Q123: Leo is a welfare recipient who qualifies
Q124: The following graph illustrates a low wage
Q125: Leo is a welfare recipient who qualifies
Q126: There are two separate labor markets in
Q127: Arguments in favor of programs that tax
Unlock this Answer For Free Now!
View this answer and more for free by performing one of the following actions

Scan the QR code to install the App and get 2 free unlocks

Unlock quizzes for free by uploading documents