The following graph illustrates a low wage labor market. 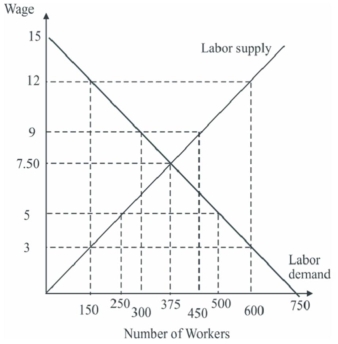
The imposition of the $12/hour minimum wage caused the total economic surplus in the labor market to __________ by __________.
A) rise;$1,012.50
B) fall;$1,012.50
C) rise;$225.00
D) fall;$1,350.00
Correct Answer:
Verified
Q119: Jen is offered a job answering the
Q120: Means-tested welfare benefits provide an incentive to
A)leave
Q121: If the elasticity of demand for labor
Q122: The following graph illustrates a low wage
Q123: Leo is a welfare recipient who qualifies
Q125: Leo is a welfare recipient who qualifies
Q126: There are two separate labor markets in
Q127: Arguments in favor of programs that tax
Q128: A(n)_ involves giving all citizens a substantial
Q129: The Earned Income Tax Credit program operates
Unlock this Answer For Free Now!
View this answer and more for free by performing one of the following actions

Scan the QR code to install the App and get 2 free unlocks

Unlock quizzes for free by uploading documents