This graph shows one consumer's demand for ice cream at the student union: 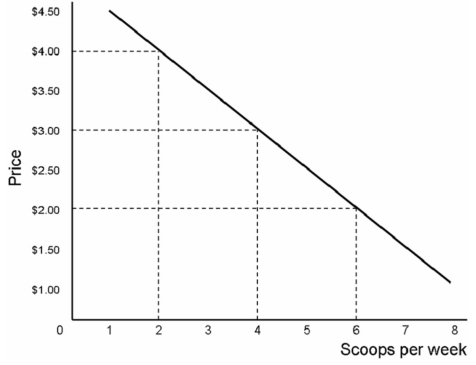
When price is $2 per scoop,each student's consumer surplus is determined by
A) the difference between maximum willingness to pay of $4.50 and $2,or $2.50.
B) the area of the triangle of dimension ($4.50 - $2.00) high and 6 long = $7.50.
C) the difference between each student's maximum price of $4.50 and $2 times the number of scoops,or $2.50 times 6 = $15.
D) The area of the triangle of dimension $4.50 high and 8 long = $18.
Correct Answer:
Verified
Q93: This graph shows one consumer's demand for
Q94: This table shows demand for shoes
Q95: This graph shows one consumer's demand for
Q96: This table shows demand for shoes
Q97: Suppose you are a government analyst,and you
Q98: This graph shows one consumer's demand for
Q99: According to the textbook,the homes of the
Q100: This graph shows one consumer's demand for
Q101: Moe's reservation price for his economics textbook
Q103: Consumer surplus measures
A)marginal utility.
B)total utility.
C)the cumulative difference
Unlock this Answer For Free Now!
View this answer and more for free by performing one of the following actions

Scan the QR code to install the App and get 2 free unlocks

Unlock quizzes for free by uploading documents