The following graph illustrates a low wage labor market. 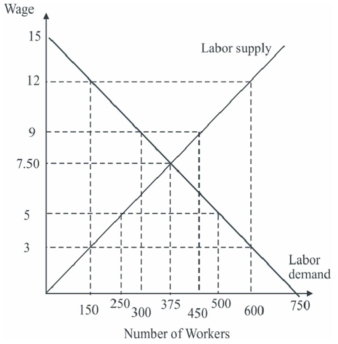
The imposition of the $12/hour minimum wage caused the total economic surplus in the labor market to __________ by __________.
A) rise;$1,012.50
B) fall;$1,012.50
C) rise;$225.00
D) fall;$1,350.00
Correct Answer:
Verified
Q125: Leo is a welfare recipient who qualifies
Q129: The Earned Income Tax Credit program operates
Q130: Leo is a welfare recipient who qualifies
Q131: Leo is a welfare recipient who qualifies
Q133: Arguments against programs that tax income to
Q135: Suppose the elasticity of labor demand is
Q139: There are two separate labor markets in
Q141: Unlike the minimum wage,the Earned Income Tax
Q142: According to the textbook,the best possible solution
Q143: To completely eliminate the concern about public
Unlock this Answer For Free Now!
View this answer and more for free by performing one of the following actions

Scan the QR code to install the App and get 2 free unlocks

Unlock quizzes for free by uploading documents